

FROM BRAD BOSWELL: Check out the 2012 CCW lists of states below. Look at where things were in 2002. In 1987, Florida was just the 9th state that added concealed carry permits. The NRA has done awesome work over 25 years. Violent crime has not gone up with the dramatic expansion of CCW permits.
http://www.gunsamerica.com/blog/one-needs-know-guns-crime-three-charts/
ALL ONE NEEDS TO KNOW ABOUT GUNS AND CRIME IN THREE CHARTS
by S.H. BLANNELBERRY on NOVEMBER 12, 2014
Admittedly, this isn’t all one needs to know about crime and guns in three charts, but it does substantiate the general claim made by many pro-gun advocates, including myself, that expanding concealed carry does not increase crime rates. In fact, one can argue the opposite is true based on the numbers which is to say more guns in the hands of law-abiding gun owners has the potential to reduce crime rates.
The first graph comes from the FBI’s latest report, “Crime in the United States,” which was released on Monday and shows the downward trend in the number of reported violent crimes over the past five years.
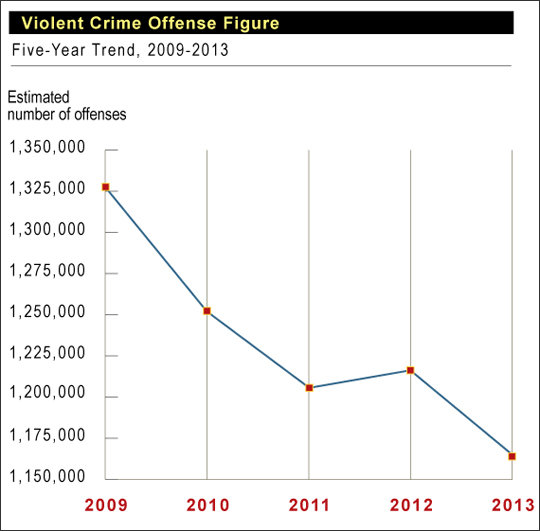
Reported instances of violent violent crime. (Photo: FBI)
Violent crime fell 4.4 percent and property crime fell 4.1 percent when compared to 2012 figures, according to the report. To quantify that, there were approximately 1,163,146 violent crimes reported to law enforcement last year, along with an estimated 8,632,512 property crimes.
To expand on this point, over the past three decades there has been a uniform drop in violent crime, property crime and the homicide rate. I pulled this from wikipedia, which uses the FBI’s crime data and analyzes crime rates per 100,000 people.
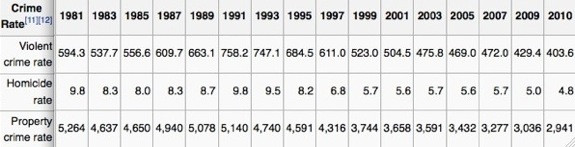
Crime Rates in U.S. per 100,000 people. (Photo: Wikipedia)
The third chart was sourced via the Wall Street Journal. It shows the expansion of concealed carry law from 2002 through 2012. Overall, the progression nationwide is from restrictive standards ‘no-issue’ aka ban on concealed carry or ‘may-issue’ (discretionary permitting) to permissive standards ‘shall-issue’ (non-discretionary permitting) and Constitutional or permit-less carry. In 2014, all 50 states including the District of Columbia have legalized concealed carry, though D.C. is currently fighting tooth and nail to keep revive it’s ban.
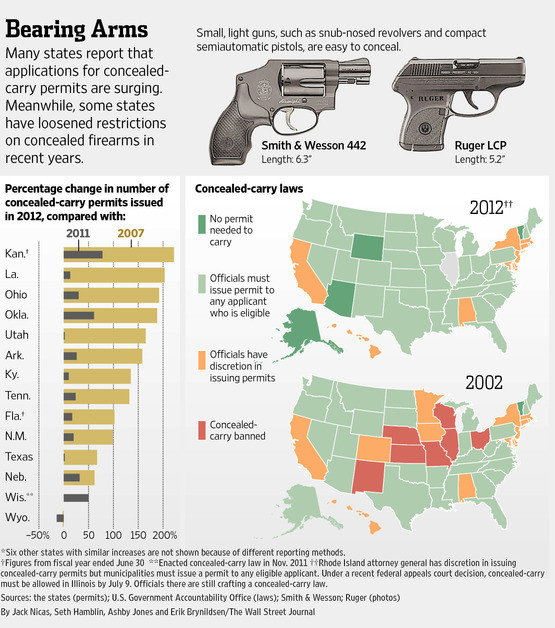
Expansion of concealed carry. (Photo: Wall Street Journal)
Juxtaposing these three charts is hard evidence to refute any gun-grabber who aggressively advocates for limitations on concealed carry. Given what the data indicates, opposing concealed carry is a completely untenable position this day and age which may explain why many gun-control organizations have, at least overtly, shifted away from attacking one’s right to keep and bear arms for self-defense outside the home and instead focus on marginal measures like universal background checks.
Put quite simply, the gun-grabber’s main argument against concealed carry, that’ll turn the country into the wild wild west, is completely laughable at this point. They know it, we know it, and now thankfully the non-gun owning public knows it.