

What’s killing local California governments is the huge cost of overpaying and over-pensioning public employees. ESPECIALLY our public safety employees (mostly police and firefighters). Some cities have declared bankruptcy, with many others bankrupt but so far refusing to acknowledging their plight.
I here offer two database tools. The first let’s you find out how your town stacks up against other cities in the state. The second tells how your state stacks up against the other states.
1. If you’d like to find out how your CA city’s police and firefighter compensation stacks up against other bergs in the state, check out this excellent interactive link from the pro-public employee SACRAMENTO BEE. You can rank the cities by cost. Or you can take your COUNTY and easily compare the cities within the county.
http://www.sacbee.com/2011/03/03/3446569/see-average-police-firefighter.html?
For instance, here’s the sorted link for firefighters’ compensation in the cities within San Diego County:
http://www.sacbee.com/2011/03/03/3446569/see-average-police-firefighter.html?appSession=554426974801871
BOTTOM LINE: “California police officers made, on average, $97,640, including overtime, incentive pay and payouts upon retirement during 2011, according to a Bee analysis of new data from the state controller’s office. Firefighters and engineers earned, on average, $118,003. Average pay for police captains across the state was $163,558; for fire captains, it was $147,626.”
CAVEAT: The figures in this database understate the total cost to taxpayers. By a lot!
It doesn’t include the cost of benefits. Nothing for the pensions or healthcare, plus many other benefits.
BTW, few cities are honest about the benefit costs anyway. That’s because no CA city or county properly budgets for the unfunded pension and (potentially even larger) retiree healthcare obligations. All cities underfund these two looney lurking liabilities.
How much does the total benefit cost entail? Unknown. My guess (and it IS a guess) is that the figures in this cash compensation survey represent less than 2/3 the total taxpayer cost (using accrual accounting) should be. In other words, take these numbers and tack on at least 50% more.
This benefit varies dramatically among jurisdictions — primarily because retiree health care benefits paid by taxpayers vary greatly. Some cities have very little or no such obligations. Some are huge — essentially totally unfunded (they use “pay go” funding).
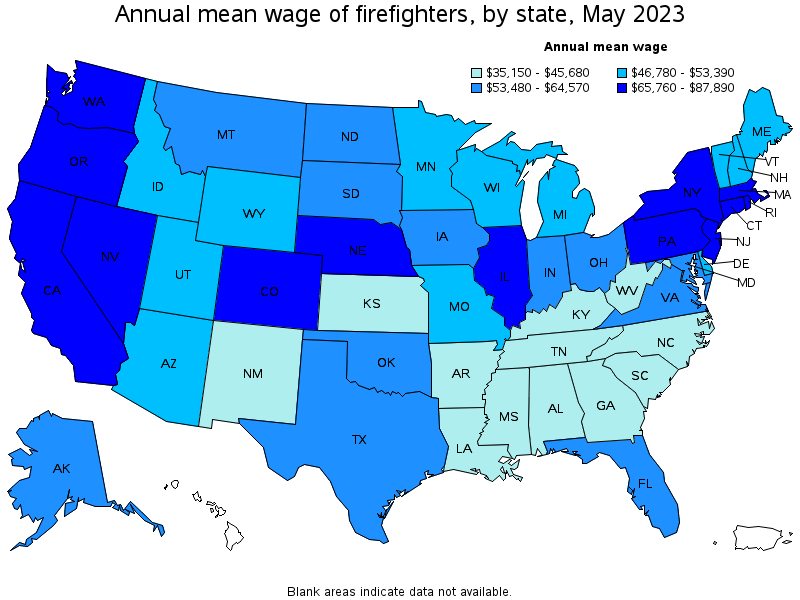
2. The Bureau of Labor Statistics (BLS) has a helpful database for comparing average salaries between states for any occupation. Here’s the link to firefighters:
http://www.bls.gov/oes/current/oes332011.htm
CAUTION! The website uses only base salary as their benchmark, which results in the compensation being GREATLY understated as a result. Still, it’s quite helpful in comparing the ranking of the states, and the relative percentage difference in compensation.
In this link, the salient numbers can be found in the “blue” U.S. map (third map — scroll down to see it) and the pay table under it. Hopefully they both show up below:
Top paying States for this occupation:
| State | Employment(1) | Employment per thousand jobs | Location quotient (9) | Hourly mean wage | Annual mean wage (2) |
|---|---|---|---|---|---|
| California | 26,550 | 1.86 | 0.81 | $34.87 | $72,540 |
| New Jersey | 4,080 | 1.08 | 0.47 | $34.55 | $71,860 |
| New York | 13,710 | 1.61 | 0.70 | $33.72 | $70,150 |
| Washington | 7,100 | 2.57 | 1.12 | $30.16 | $62,730 |
| Connecticut | 3,040 | 1.88 | 0.82 | $27.75 | $57,730 |
One can move one’s cursor over a state to see the pop-up summary of that state — including average wage. But it doesn’t work on this blog map, so you’ll need to go the BLS link for that aspect. California is the highest paying state.
Aside from NY and NJ, everyone else pays significantly less. Usually a lot less. Indeed, comparing CA firefighter basic wages with the average firefighter’s pay in the other 49 states ($45,280), we pay 60.2% higher than the other states’ average.
A reminder — this is just the base wage — the real cost is over 50% higher — sometimes approaching DOUBLE the base wage. I’m assuming the same is true for the other states — a conservative assumption.
To see the BLS stats on “police and sheriffs patrol officers,” go to this link:
http://www.bls.gov/oes/current/oes333051.htm
CA is the 2nd highest paying state (after NJ), and pays 56.0% higher for cops than is paid for the same jobs in the other 49 states.
If you’ve read this far, you need professional help. This is wonky stuff. But never let it be said I left my readers hungry for facts.