

BOTTOM LINE: OLD FIGURES — “The average CA firefighter was paid 60% more than paid firefighters in other 49 states. CA cops was paid 56% more.” I just did the updates, based on the latest BLS statistics. It’s gotten worse!
NEW FIGURES: The average CA firefighter is paid 77.4% more than paid firefighters in other 49 states. CA cops are paid 66.3% more than their counterparts in other states.
Yet the CA 2017 median household income (including gov’t workers) is only 19.0% above the national average. Clearly, in the Golden State, the private sector workers are the serfs, and the public employees are the new aristocracy.
What’s killing California’s state and local governments is the huge cost of overpaying and over-pensioning public employees. ESPECIALLY our public safety employees (mostly police and firefighters). Some cities have declared bankruptcy, with others facing similar fiscal plights (not that they acknowledge it).
I here offer two sets of figures. The first gives the average 2011 figures for CA police and firefighter pay. The second tells how CA stacks up against the other 49 states — and the means to compare any state.
1. Here’s some outdated 2011 figures to ponder (the URL from the SACRAMENTO BEE is no longer available). Most firefighters’ pay has risen at least 20% since 2011:
“California police officers made, on average, $97,640, including overtime, incentive pay and payouts upon retirement during 2011, according to a Bee analysis of new data from the state controller’s office. Firefighters and engineers earned, on average, $118,003. Average pay for police captains across the state was $163,558; for fire captains, it was $147,626.”
[NOTE: A “fire captain” is the person in charge of a three or four firefighter truck — hardly a high level position. Most firefighters retire as “fire captains.” That position and their highest pay is the basis for their pension — commonly 90% of pay (not counting overtime) for their 30 years service.]
CAVEAT: The figures in this database understate the total cost to taxpayers. By a lot! It doesn’t include the cost of benefits. Nothing for the pensions or healthcare, plus many other benefits.
BTW, few cities are honest about the benefit costs anyway. That’s because no CA city or county properly budgets for the unfunded pension and (potentially even larger) retiree healthcare obligations. All cities underfund these two loony lurking liabilities.
How much does the total benefit cost entail? Unknown. My guess (and it IS a guess) is that the figures in this cash compensation survey represent less than 2/3 the total taxpayer cost (using accrual accounting) should be. In other words, take these numbers and tack on at least 50% more.
This benefit varies dramatically among jurisdictions — primarily because retiree health care benefits paid by taxpayers vary greatly. Some cities have very little or no such obligations. Some are huge — and essentially totally unfunded (they use “pay as you go” funding).
2. The Bureau of Labor Statistics (BLS) has a helpful database for comparing average salaries between states for any occupation. Here’s the link to firefighters:
http://www.bls.gov/oes/current/oes332011.htm
CAUTION! The website uses only base salary as their benchmark, which results in the compensation being GREATLY understated as a result. Still, it’s quite helpful in comparing the ranking of the states, and the relative percentage difference in compensation.
In this link, the salient numbers can be found in the “blue” U.S. map (third map in the BLS article — scroll down to see it) and the pay table under it. But to see the actual numbers on the map, you have to go to the BLS link.
http://www.bls.gov/oes/current/oes332011.htm
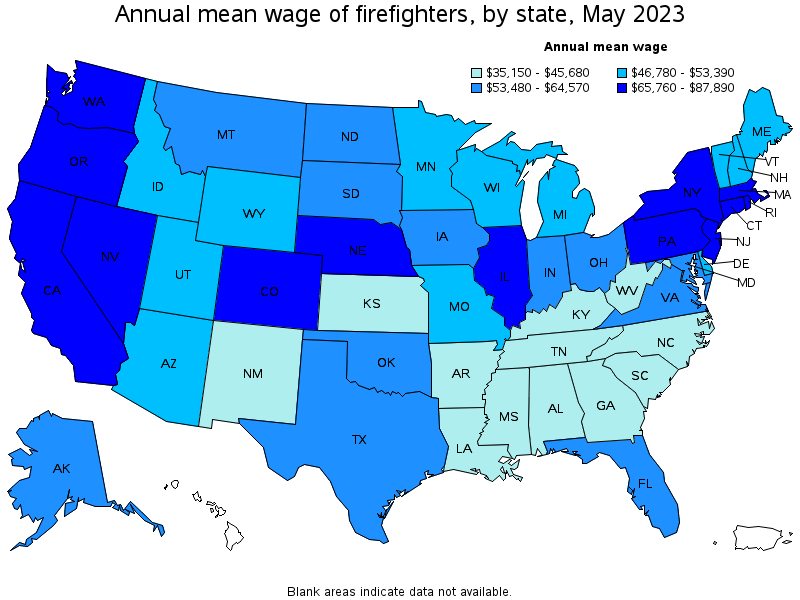
| State | Employment (1) | Employment per thousand jobs | Location quotient (9) | Hourly mean wage | Annual mean wage (2) |
|---|---|---|---|---|---|
| California | 32,910 | 1.94 | 0.87 | $39.22 | $81,580 |
| New Jersey | 5,590 | 1.38 | 0.62 | $36.80 | $76,530 |
| Washington | 7,750 | 2.38 | 1.07 | $35.50 | $73,850 |
| New York | 11,880 | 1.27 | 0.57 | $35.44 | $73,710 |
| Nevada | 1,970 | 1.46 | 0.66 | $32.13 | $66,830 |
One can move one’s cursor over a state to see the pop-up summary of that state — including average wage. But it doesn’t work on this blog map, so you’ll need to go the BLS link for that aspect. California is easily the highest paying state. CA pays 6.5% more than the 2nd highest state (NJ).
Indeed, comparing CA firefighter basic wages with the average firefighter’s pay in the other 49 states ($45,578), CA pays an astonishing 77.4% more than the other states’ average.
A reminder — this is just the base wage — the real cost is over 50% higher — sometimes approaching DOUBLE the base wage. I’m assuming the same is true for the other states — a conservative assumption.
***
The CA disparity is almost as bad when we look at the pay of cops. To see the BLS stats on “police and sheriffs patrol officers,” go to this link:
http://www.bls.gov/oes/current/oes333051.htm
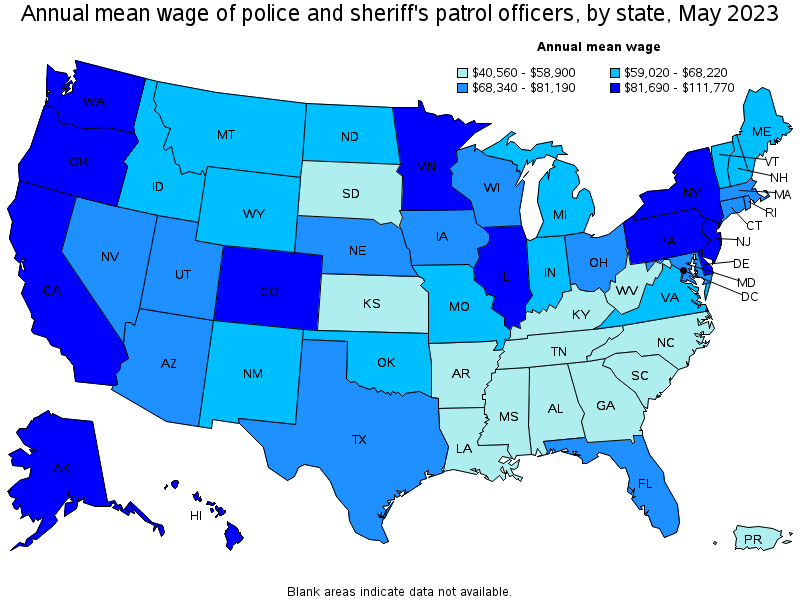
| State | Employment (1) | Employment per thousand jobs | Location quotient (9) | Hourly mean wage | Annual mean wage (2) |
|---|---|---|---|---|---|
| California | 72,680 | 4.27 | 0.94 | $48.74 | $101,380 |
| Alaska | 1,070 | 3.40 | 0.74 | $42.32 | $88,030 |
| New Jersey | 19,950 | 4.93 | 1.08 | $40.25 | $83,720 |
| Washington | 9,670 | 2.97 | 0.65 | $37.34 | $77,670 |
| Illinois | 30,370 | 5.07 | 1.11 | $36.40 | $75,720 |
CA is the easily the highest paying state. CA cops are paid on average 15.2% more than 2nd place Alaska). CA pays 66.3% higher for cops than is paid for the same jobs in the other 49 states.
If you’ve read this far, you may need professional help. This is wonky stuff. But never let it be said that I left my readers hungry for facts.